Metrics
Metrics give insight into a system's health. In addition, they allow detection of changes happening over time. Automatic alerts (e.g. by using Alertmanager) can be configured to provide notifications in case of error conditions or incidents.
Currently, the following SeaTable components expose metrics in a Prometheus-compatible format:
- api-gateway
- dtable-db
- caddy
In addition, Gunicorn and NGINX can be configured to expose metrics in a different format. Exporters can be used to transform these into a Prometheus-compatible format.
SeaTable Components
api-gateway
You can enable the /metrics endpoint and configure the basic auth credentials by adding the following configuration block inside /opt/seatable-server/seatable/conf/dtable-api-gateway.conf:
[metrics]
enable_basic_auth = true
username = "<username>"
password = "<password>"
Note: SeaTable does not create the dtable-api-gateway.conf configuration file by default. If it does not exist yet, simply create it.
Remember to restart SeaTable by running the following command:
docker restart seatable-server
You can test the metrics endpoint by running the following command on the host:
curl -sS https://$SEATABLE_SERVER_HOSTNAME/api-gateway/metrics --user "<username>:<password>"
Example Output
# HELP api_gateway_base_cache_hit_ratio Total base cache hit ratio
# TYPE api_gateway_base_cache_hit_ratio gauge
api_gateway_base_cache_hit_ratio 0.6086956521739131
# HELP api_gateway_base_cache_hit_total Total base cache hit number
# TYPE api_gateway_base_cache_hit_total counter
api_gateway_base_cache_hit_total 14
# HELP api_gateway_base_cache_miss_total Total base cache miss number
# TYPE api_gateway_base_cache_miss_total counter
api_gateway_base_cache_miss_total 9
# HELP api_gateway_obj_cache_eviction_number Total obj cache eviction number
# TYPE api_gateway_obj_cache_eviction_number counter
api_gateway_obj_cache_eviction_number 5
# HELP api_gateway_obj_cache_hit_ratio Total obj cache hit ratio
# TYPE api_gateway_obj_cache_hit_ratio gauge
api_gateway_obj_cache_hit_ratio 0.6521739130434783
# HELP api_gateway_obj_cache_hit_total Total obj cache hit number
# TYPE api_gateway_obj_cache_hit_total counter
api_gateway_obj_cache_hit_total 15
# HELP api_gateway_obj_cache_miss_total Total obj cache miss number
# TYPE api_gateway_obj_cache_miss_total counter
api_gateway_obj_cache_miss_total 8
dtable-db
You can enable the /metrics endpoint and configure the basic auth credentials by adding the following configuration block inside /opt/seatable-server/seatable/conf/dtable-db.conf:
[metrics]
enable_basic_auth = true
username = "<username>"
password = "<password>"
Remember to restart SeaTable by running the following command:
docker restart seatable-server
You can test the metrics endpoint by running the following command on the host:
docker exec seatable-server curl -sS http://localhost:7777/metrics --user "<username>:<password>"
Note: curl is executed inside the container since port 7777 is not exposed to the host by default.
Example Output
# HELP dtable_db_archive_task_count Number of currently running import tasks
# TYPE dtable_db_archive_task_count gauge
dtable_db_archive_task_count 0
# HELP dtable_db_cache_base_count Number of currently cached bases
# TYPE dtable_db_cache_base_count gauge
dtable_db_cache_base_count 2
# HELP dtable_db_cache_memory The memory currently used by dtable cache
# TYPE dtable_db_cache_memory gauge
dtable_db_cache_memory 528760
# HELP dtable_db_in_flight_request_num The number of currently running http requests
# TYPE dtable_db_in_flight_request_num gauge
dtable_db_in_flight_request_num{method="GET",request="LIST ROWS"} 0
dtable_db_in_flight_request_num{method="POST",request="sql select"} 0
# HELP dtable_db_index_adding_count Number of currently running index adding
# TYPE dtable_db_index_adding_count gauge
dtable_db_index_adding_count 0
# HELP dtable_db_is_doing_backup Is dtable db doing backup now
# TYPE dtable_db_is_doing_backup gauge
dtable_db_is_doing_backup 0
# HELP dtable_db_is_doing_cleanup Is dtable db doing cleanup now
# TYPE dtable_db_is_doing_cleanup gauge
dtable_db_is_doing_cleanup 0
# HELP dtable_db_opened_bases Number of opened archived bases
# TYPE dtable_db_opened_bases gauge
dtable_db_opened_bases 1
# HELP dtable_db_opened_olap_bases Number of opened OLAP bases
# TYPE dtable_db_opened_olap_bases gauge
dtable_db_opened_olap_bases 0
# HELP dtable_db_request_duration_seconds Total request duration
# TYPE dtable_db_request_duration_seconds counter
dtable_db_request_duration_seconds{method="GET",request="LIST ROWS"} 0.07200000000000001
# HELP dtable_db_request_total Total http request count
# TYPE dtable_db_request_total counter
dtable_db_request_total{method="GET",request="LIST ROWS"} 3
# HELP dtable_db_unarchive_task_count Number of currently running unarchive tasks
# TYPE dtable_db_unarchive_task_count gauge
dtable_db_unarchive_task_count 0
Gunicorn
Gunicorn only supports the older statsD protocol to emit metrics. statsd_exporter can be used to ingest these metrics and transform them into Prometheus-compatible metrics.
You can enable this by adding the following configuration setting inside /opt/seatable-server/seatable/conf/gunicorn.py:
statsd_host = 'statsd-exporter:9125'
Afterwards, Gunicorn must be restarted in order to apply the configuration changes:
docker restart seatable-server
You can use the following statsd-exporter.yml file to deploy the exporter alongside SeaTable:
services:
  statsd-exporter:
    image: prom/statsd-exporter:v0.29.0
    container_name: statsd-exporter
    restart: unless-stopped
    command: ["--statsd.mapping-config=/tmp/statsd-exporter-config.yml"]
    networks:
      - o11y-net
    ports:
      - 127.0.0.1:9102:9102
    volumes:
      - ./statsd-exporter-config.yml:/tmp/statsd-exporter-config.yml:ro

  # Gunicorn needs to be able to access statsd-exporter
  seatable-server:
    networks:
      - o11y-net

networks:
  o11y-net:
    name: o11y-net
This is the corresponding configuration file for the exporter (statsd-exporter-config.yml) that is mounted into the container:
defaults:
  observer_type: histogram

mappings:
  - match: gunicorn.request.status.*
    name: gunicorn_requests_total
    labels:
      status: $1
After adding statsd-exporter.yml to the COMPOSE_FILE variable and starting the container, the exporter will serve a metrics endpoint that contains metrics in a Prometheus-compatible format:
curl -sS 127.0.0.1:9102/metrics
Example Output
# HELP gunicorn_request_duration Metric autogenerated by statsd_exporter.
# TYPE gunicorn_request_duration histogram
gunicorn_request_duration_bucket{le="0.005"} 7
gunicorn_request_duration_bucket{le="0.01"} 50
gunicorn_request_duration_bucket{le="0.025"} 142
gunicorn_request_duration_bucket{le="0.05"} 159
gunicorn_request_duration_bucket{le="0.1"} 163
gunicorn_request_duration_bucket{le="0.25"} 163
gunicorn_request_duration_bucket{le="0.5"} 164
gunicorn_request_duration_bucket{le="1"} 172
gunicorn_request_duration_bucket{le="2.5"} 173
gunicorn_request_duration_bucket{le="5"} 173
gunicorn_request_duration_bucket{le="10"} 173
gunicorn_request_duration_bucket{le="+Inf"} 173
gunicorn_request_duration_sum 10.003946999999993
gunicorn_request_duration_count 173
# HELP gunicorn_requests Metric autogenerated by statsd_exporter.
# TYPE gunicorn_requests counter
gunicorn_requests 173
# HELP gunicorn_requests_total Metric autogenerated by statsd_exporter.
# TYPE gunicorn_requests_total counter
gunicorn_requests_total{status="200"} 149
gunicorn_requests_total{status="302"} 24
# HELP gunicorn_workers Metric autogenerated by statsd_exporter.
# TYPE gunicorn_workers gauge
gunicorn_workers 5
NGINX
In order to expose basic metrics regarding the number of connections and handled requests, the ngx_http_stub_status_module module must be enabled. You can achieve this by adding the following configuration block at the bottom of the NGINX configuration file, which is located at /opt/seatable-compose/config/seatable-config.conf:
server {
    listen 8080;

    location = /metrics {
        stub_status;
    }
}
Using a separate HTTP server ensures that the /metrics route won't be publicly accessible.
You can test the validity of your configuration file by running the following command:
docker exec -it seatable-server nginx -t
This should return the following output:
nginx: the configuration file /etc/nginx/nginx.conf syntax is ok
nginx: configuration file /etc/nginx/nginx.conf test is successful
NGINX must be restarted in order to apply the configuration changes:
docker exec -it seatable-server sv restart nginx
nginx-prometheus-exporter must be deployed alongside your SeaTable instance in order to expose these metrics in a Prometheus-compatible format. You can use the following nginx-exporter.yml file to get started:
services:
  nginx-exporter:
    image: nginx/nginx-prometheus-exporter:1.5.1
    container_name: nginx-exporter
    restart: unless-stopped
    command: ["--nginx.scrape-uri=http://seatable-server:8080/metrics"]
    networks:
      - o11y-net
    ports:
      - 127.0.0.1:9113:9113

  # nginx-exporter needs to access NGINX running inside seatable-server
  seatable-server:
    networks:
      - o11y-net

networks:
  o11y-net:
    name: o11y-net
Remember to add nginx-exporter.yml to the COMPOSE_FILE variable and start the exporter by running the following command:
docker compose up -d
You can test the metrics endpoint by running the following command on the host:
curl -sS http://127.0.0.1:9113/metrics
Example Output
# HELP nginx_connections_accepted Accepted client connections
# TYPE nginx_connections_accepted counter
nginx_connections_accepted 8
# HELP nginx_connections_active Active client connections
# TYPE nginx_connections_active gauge
nginx_connections_active 7
# HELP nginx_connections_handled Handled client connections
# TYPE nginx_connections_handled counter
nginx_connections_handled 8
# HELP nginx_connections_reading Connections where NGINX is reading the request header
# TYPE nginx_connections_reading gauge
nginx_connections_reading 0
# HELP nginx_connections_waiting Idle client connections
# TYPE nginx_connections_waiting gauge
nginx_connections_waiting 6
# HELP nginx_connections_writing Connections where NGINX is writing the response back to the client
# TYPE nginx_connections_writing gauge
nginx_connections_writing 1
# HELP nginx_exporter_build_info A metric with a constant '1' value labeled by version, revision, branch, goversion from which nginx_exporter was built, and the goos and goarch for the build.
# TYPE nginx_exporter_build_info gauge
nginx_exporter_build_info{branch="main",goarch="amd64",goos="linux",goversion="go1.25.3",revision="bae43bc818cd6e47a08163a7b31f355f454e9ecb",tags="unknown",version="0.0.0-SNAPSHOT-bae43bc"} 1
# HELP nginx_http_requests_total Total http requests
# TYPE nginx_http_requests_total counter
nginx_http_requests_total 153
# HELP nginx_up Status of the last metric scrape
# TYPE nginx_up gauge
nginx_up 1
Caddy
Caddy natively supports exposing metrics in a Prometheus-compatible format. Since SeaTable uses caddy-docker-proxy, metrics can be enabled by adding Docker labels to the Caddy service.
Create a caddy-metrics.yml file in your /opt/seatable-compose directory:
services:
  caddy:
    labels:
      caddy_0.metrics:
      caddy_0.metrics.per_host:
      caddy_1: ":2020"
      caddy_1.metrics: /metrics
    ports:
      - 127.0.0.1:2020:2020
    networks:
      - o11y-net

networks:
  o11y-net:
    name: o11y-net
These labels configure Caddy to collect per-host metrics and expose them on a dedicated, read-only endpoint on port 2020 (separate from the Caddy Admin API on port 2019).
Add caddy-metrics.yml to the COMPOSE_FILE variable in your .env file and restart the containers:
docker compose up -d
You can test the metrics endpoint by running the following command on the host:
curl -sS http://127.0.0.1:2020/metrics
Scraping
There are many ways to ingest the metrics into Prometheus.
Grafana Alloy
You can use Grafana Alloy to scrape metrics from SeaTable components and forward them to an existing Prometheus server using Prometheus' remote-write functionality.
The following YAML manifest can serve as a starting point to deploy Alloy:
services:
  alloy:
    image: grafana/alloy:v1.12.0
    container_name: alloy
    restart: unless-stopped
    environment:
      - PROMETHEUS_URL=${PROMETHEUS_URL:?Variable is not set or empty}
      - PROMETHEUS_USERNAME=${PROMETHEUS_USERNAME:?Variable is not set or empty}
      - PROMETHEUS_PASSWORD=${PROMETHEUS_PASSWORD:?Variable is not set or empty}
      - SEATABLE_METRICS_USERNAME=${SEATABLE_METRICS_USERNAME:?Variable is not set or empty}
      - SEATABLE_METRICS_PASSWORD=${SEATABLE_METRICS_PASSWORD:?Variable is not set or empty}
    networks:
      - o11y-net
    volumes:
      - ./config.alloy:/etc/alloy/config.alloy:ro
      - /opt/alloy-data:/var/lib/alloy/data
    command:
      - run
      - --server.http.listen-addr=0.0.0.0:12345
      - --storage.path=/var/lib/alloy/data
      - /etc/alloy/config.alloy

  # Attach seatable-server container to o11y-net
  # This allows Alloy to scrape metrics
  seatable-server:
    networks:
      - o11y-net

networks:
  o11y-net:
    name: o11y-net
The following config.alloy config file should be created inside the same directory:
prometheus.remote_write "default" {
  endpoint {
    url = env("PROMETHEUS_URL")
    basic_auth {
      username = env("PROMETHEUS_USERNAME")
      password = env("PROMETHEUS_PASSWORD")
    }
  }
}

prometheus.scrape "seatable_metrics" {
  targets = [
    {"__address__" = "seatable-server:7780", "instance" = "api-gateway"},
    {"__address__" = "seatable-server:7777", "instance" = "dtable-db"},
    {"__address__" = "statsd-exporter:9102", "instance" = "gunicorn"},
    {"__address__" = "nginx-exporter:9113", "instance" = "nginx"},
  ]

  basic_auth {
    username = env("SEATABLE_METRICS_USERNAME")
    password = env("SEATABLE_METRICS_PASSWORD")
  }

  forward_to = [prometheus.remote_write.default.receiver]
  scrape_interval = "15s"
}

// Caddy metrics do not use basic authentication and
// therefore require a separate scrape configuration.
prometheus.scrape "caddy_metrics" {
  targets = [
    {"__address__" = "caddy:2020", "instance" = "caddy"},
  ]

  forward_to = [prometheus.remote_write.default.receiver]
  scrape_interval = "15s"
}
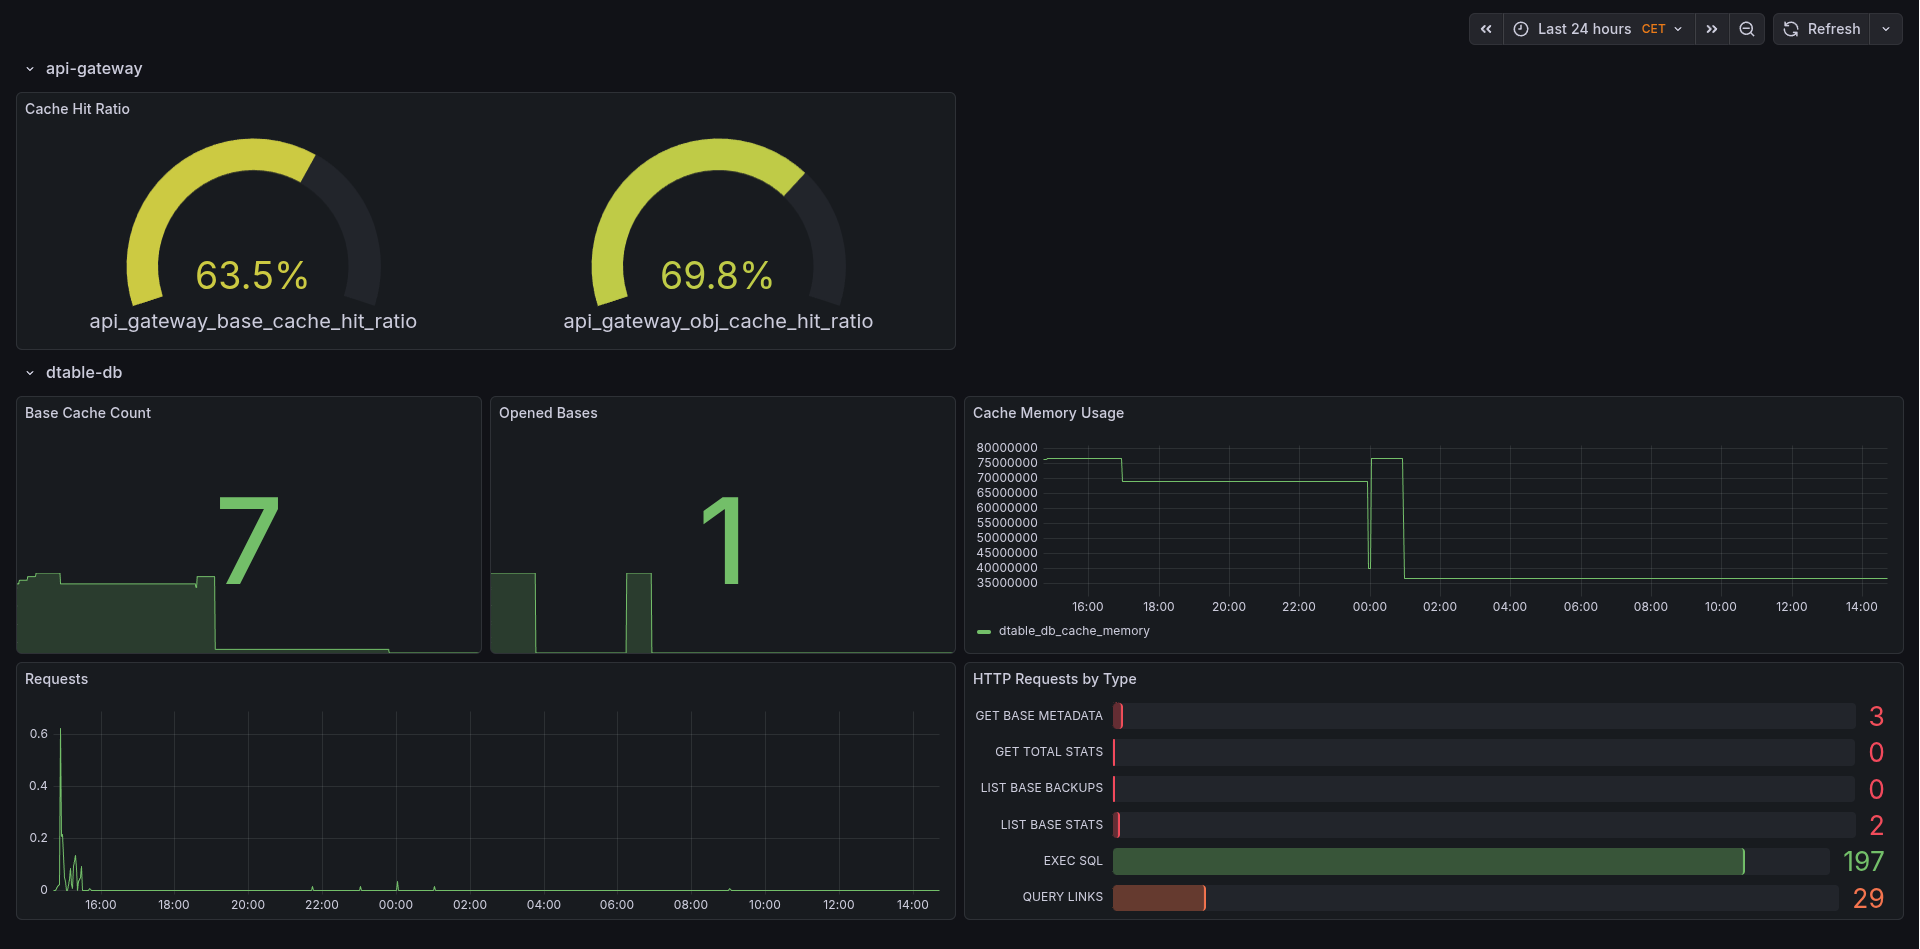
Grafana Dashboard
We have published a Grafana dashboard that displays these metrics. You can import this dashboard into your Grafana instance by specifying its ID (24942).